Week 4: September 30, 2024
This blog is an ongoing project for Professor Ryan Enos' Election Analytics Course at Harvard College (GOV 1347, Fall 2024). It will be updated weekly with posts analyzing how different features impact the likelihood of Kamala Harris (D) or Donald Trump (R) winning the 2024 U.S. Presidential Election or winning specific states in the election. The blog will culminate in a final predictive model for the outcome of the general election.Context & Question
In the 18 elections since the end of World War II (1948), incumbent candidates have won a third of them. But considering that the incumbent president has only run in 11 of those elections, the statistic comes out to be that the incumbent won in about **two-thirds** of elections in which they were running. So this week's blog explores whether incumbency really matters in a presidential race, and whether it's a good prediction of an election outcome. We can measure "incumbency" both on the basis of the candidate and the party. This is especially interesting in the 2024 race because one candidate (Donald Trump) is not a *direct* incumbent, meaning he did not serve in the pevious term, but he has served before. And the other candidate (Kamala Harris) is a member of the incumbent party *and* incumbent administration, but is not a president seeking re-election.The Data
I'll use data about the popular vote in each state since 1948 to determine whether incumbents performed consistently well or poorly in certain states over time, or whether their performance in different states was subject to the volatility in states (i.e. is incumbent performance consistent even in states considered "battleground" between parties?)Results
First, I decided to investigate whether particular states tend to vote for incumbent parties more often than others. The maps below show each state that voted for an incumbent party versus a challenger party’s candidate in every election since 1948.
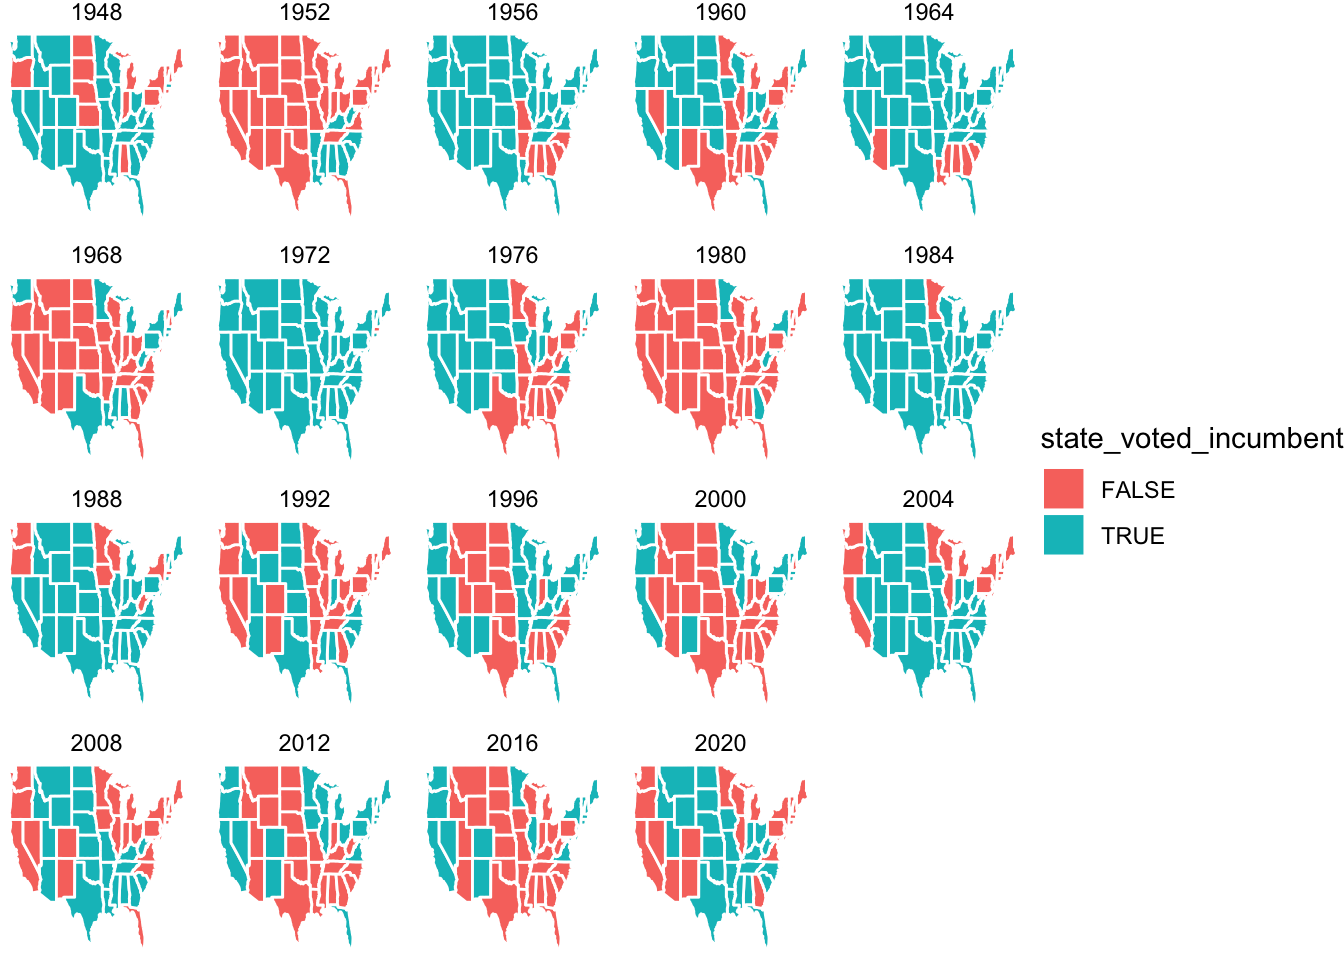
There is no visible trend of states that consistently vote for incumbent parties or consistently vote for challenger party candidates. So I decided to calculate the percentages of times since 1948 that each state has voted for an incumbent party’s candidate. The results are in the table below:
##                   state  n pct_incumbent
## 1            California 12     0.6666667
## 2               Florida 12     0.6666667
## 3                 Idaho 12     0.6666667
## 4                  Iowa 12     0.6666667
## 5              Kentucky 12     0.6666667
## 6                 Maine 12     0.6666667
## 7            New Mexico 12     0.6666667
## 8              Oklahoma 12     0.6666667
## 9                  Utah 12     0.6666667
## 10             Virginia 12     0.6666667
## 11           Washington 12     0.6666667
## 12        West Virginia 12     0.6666667
## 13              Wyoming 12     0.6666667
## 14              Arizona 11     0.6111111
## 15             Colorado 11     0.6111111
## 16          Connecticut 11     0.6111111
## 17             Illinois 11     0.6111111
## 18               Kansas 11     0.6111111
## 19            Louisiana 11     0.6111111
## 20             Maryland 11     0.6111111
## 21              Montana 11     0.6111111
## 22             Nebraska 11     0.6111111
## 23               Nevada 11     0.6111111
## 24         North Dakota 11     0.6111111
## 25                 Ohio 11     0.6111111
## 26         Rhode Island 11     0.6111111
## 27         South Dakota 11     0.6111111
## 28            Tennessee 11     0.6111111
## 29                Texas 11     0.6111111
## 30              Vermont 11     0.6111111
## 31               Alaska 10     0.5555556
## 32             Arkansas 10     0.5555556
## 33              Indiana 10     0.5555556
## 34             Michigan 10     0.5555556
## 35            Minnesota 10     0.5555556
## 36          Mississippi 10     0.5555556
## 37        New Hampshire 10     0.5555556
## 38           New Jersey 10     0.5555556
## 39             New York 10     0.5555556
## 40               Oregon 10     0.5555556
## 41              Alabama  9     0.5000000
## 42             Delaware  9     0.5000000
## 43               Hawaii  9     0.5000000
## 44        Massachusetts  9     0.5000000
## 45             Missouri  9     0.5000000
## 46       North Carolina  9     0.5000000
## 47         Pennsylvania  9     0.5000000
## 48       South Carolina  9     0.5000000
## 49            Wisconsin  9     0.5000000
## 50              Georgia  8     0.4444444
## 51 District Of Columbia  7     0.3888889
Interestingly, the states that voted for an incumbent party most often candidate did so in two-thirds of the elections since 1948. Washington D.C. was least likely to pick an incumbent candidate, and it did so just over a third of the time since 1948. Overall, it makes sense that states do not consistently vote for an incumbent or a challenger over time because the incumbent’s party tends to flip from Democrat to Republican, and vice versa, every few terms. Many states show consistency in the party they vote for, which means that they will necessarily swap from voting for to against an incumbent (or vice versa) every few elections. It would be most interesting to see if battleground states (states that notably don’t show consistency in the party they vote for) tended to vote for incumbent parties more than challengers, but that is not evident from the analysis above.
I was curious as to whether there is a relationship between partisanship and a state’s tendency to vote for an incumbent party. The bar graph below shows how often states have voted for incumbent parties, colored by their average Democratic Vote Share since 1948.
state_votes <- state_votes %>%
                left_join(state_votes2, by=join_by(state))

data <- state_votes %>% select(state, mean_D_pv2p, pct_incumbent) %>% distinct()

ggplot(data, aes(x=pct_incumbent, y=reorder(state, pct_incumbent), fill=mean_D_pv2p)) +
  geom_bar(stat="identity") +
  scale_fill_gradient2(low = "red", mid = "white", high = "navyblue", midpoint = 50,
    breaks = 5, name = "Mean D Vote Share Since 1948")

Based on the plot, it seems that some of the strongest Republican-leaning states tend to vote for incumbent candidates more frequently and that the more reliably Democratic states have voted for challengers more frequently. However, many of the most reliably-Democratic and reliably-Republican states have the same rates of voting for incumbents versus challengers (e.g. California and Idaho, and Rhode Island and Kansas, respectively).